
Your Shopify app analytics in one place: revenue, MRR, and the numbers that move every day, built to check each morning. See the last 30 days against the 30 before, what updated today, and where your trials stand.
Prys is the Shopify app growth platform for Shopify app developers.
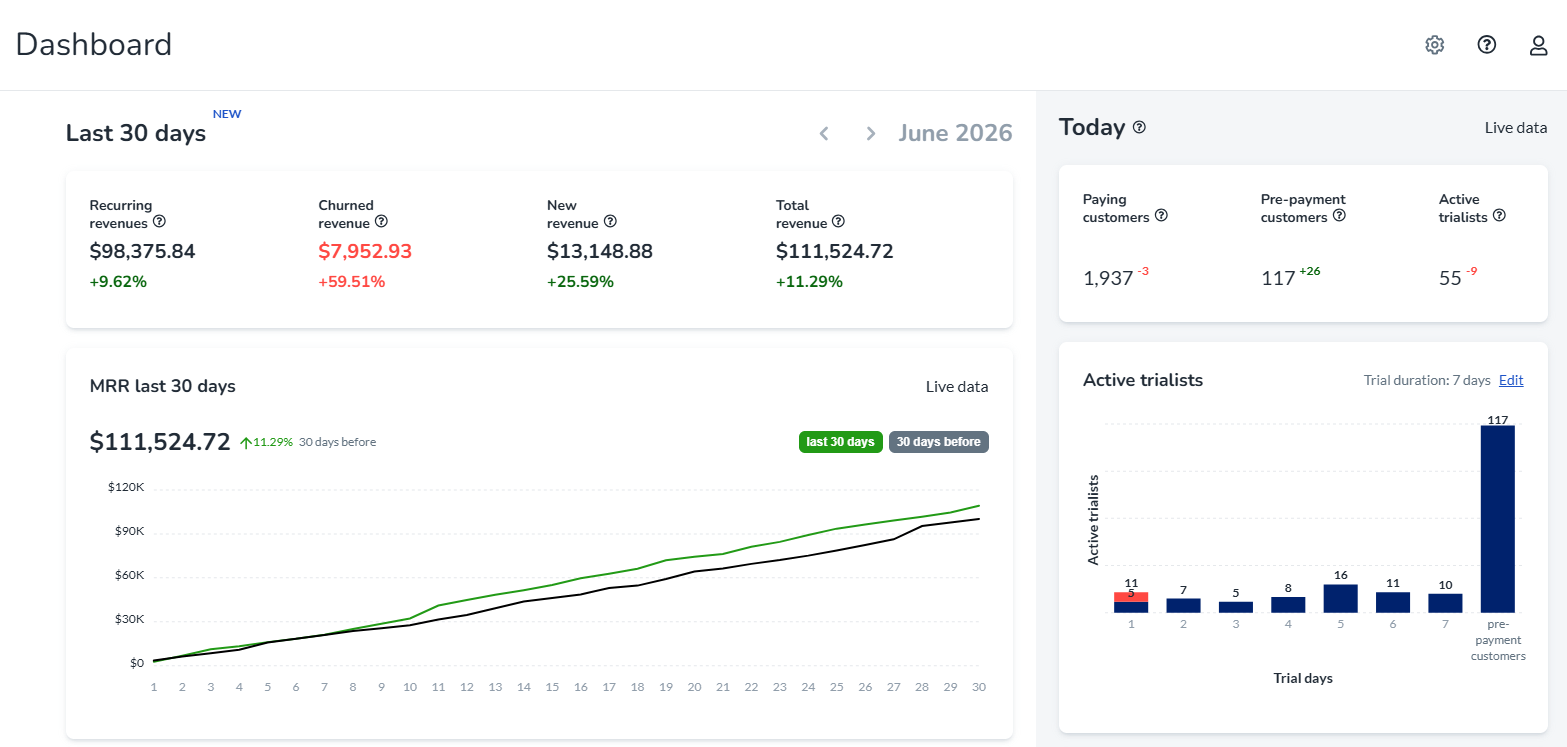
Revenue split into recurring and new, with lost revenue beside it, over a cumulative MRR-to-date chart. See the last 30 days, or switch to month to date.
ARPU, churn, LTV, and paying customers, each compared to the matching prior period, with the delta in green or red so you read the trend instantly.
Today's revenue and the value your new subscribers generated, plus active trialists by day and pre-payment customers, so you catch momentum as it happens.
The Prys dashboard is your Shopify app's daily analytics overview. The default view is the last 30 days against the 30 days before, and one click switches to month to date versus last month. Revenue splits into recurring, from merchants who paid in the prior period, and new, from first payments, with lost revenue beside it to compare, all over a cumulative MRR-to-date chart that climbs through the period. It is built to be checked every morning, per app, and there is a free version.
Every headline number carries a delta against the matching prior period, green when the trend is good and red when it is not, and ARPU, churn, LTV, and paying customers all move with it. You can filter the whole view by source, campaign, or keyword the way you do on the customers page, and an installers column with store counts shows who arrived, not just how much they paid.
The right side is today. It shows today's revenue, the value your new subscribers generated, active trialists grouped by how many days ago they subscribed, and pre-payment customers who are past their trial but have not paid yet. For apps on streaming data it is close to real time, so the leading edge of your funnel is visible the moment it moves.
Connect Google or Meta and each gets its own dashboard inside Prys: spend, ROAS, and the full funnel to paying customers, by campaign and keyword for Google and by ad set for Meta, with ROAS colour-coded and a conversion events log of every event Prys sent to the platform.
Revenue split into recurring and new, a cumulative MRR-to-date chart, and a KPIs strip with ARPU, churn, LTV, and paying customers, each versus the prior period. The default view is the last 30 days.
Both. The default is the last 30 days against the 30 before, and one click switches to month to date versus last month.
Today: today's revenue and value generated, active trialists by day, and pre-payment customers. For streaming apps it is close to real time.
Yes. A free version of the dashboard covers your core revenue and KPIs before you upgrade.
Revenue, MRR, and every KPI in one dashboard, the last 30 days or monthly, each versus the prior period, with today and your trials at a glance.