
See your revenue, MRR, ARPU, LTV, churn, and the conversion rates that predict growth, each with your number beside the benchmark. So you know not just where you stand, but whether it is good.
Prys is the Shopify app growth platform for Shopify app developers.
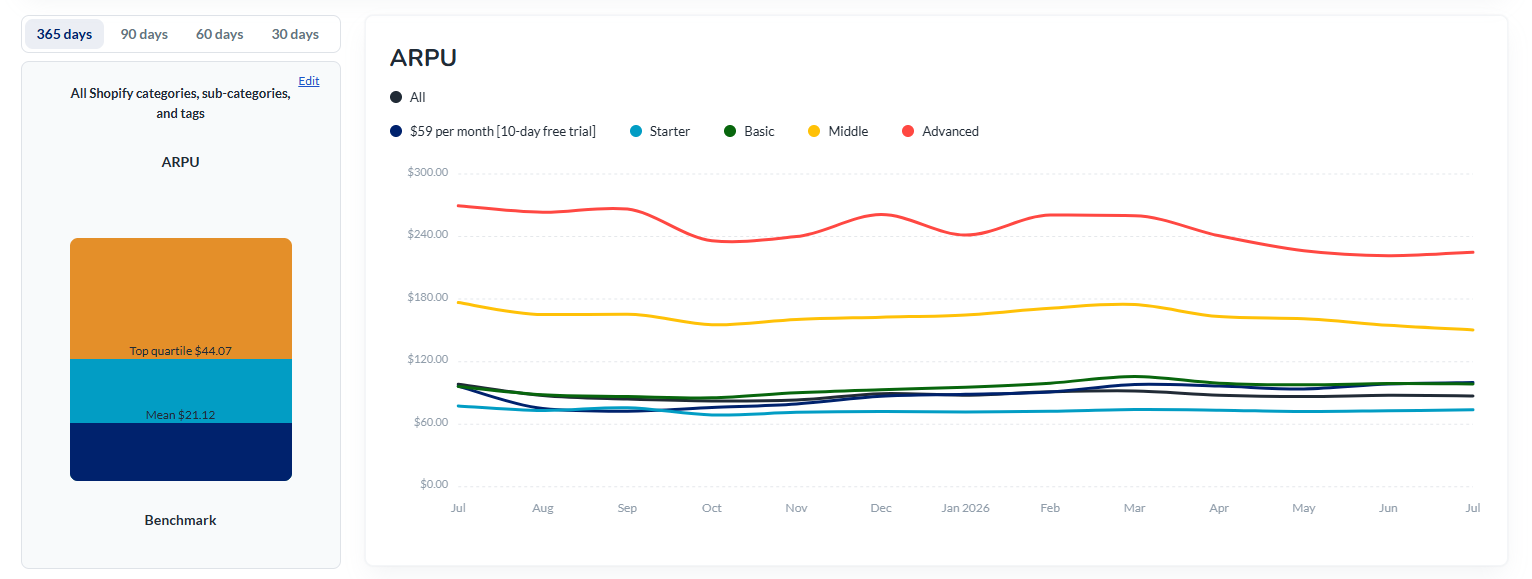
Revenue, MRR, ARPU, LTV, churn, and conversion rates, each showing your number against the average and top-quartile app.
Not vanity metrics. The KPIs that separate apps that scale from apps that stall, measured monthly the way investors read them.
A free version of the Revenues and KPIs page, so you can see where you stand before you pay anything.
The Revenues and KPIs page brings your Shopify app's revenue and every KPI that matters together, each with a benchmark beside it. Revenue and MRR, ARPU, lifetime value, churn, and the conversion rates from visit to paying customer, all drawn from your own data and set against the average and top-quartile app, from aggregated data across 500+ apps on Prys. ARPU and churn are measured monthly, on a trailing basis, the way they should be. A free version lets you see where you stand before you pay anything.
The metrics that predict whether you grow: how many visitors become paying customers, what each pays (ARPU), how long they stay (churn and lifetime value), and how your MRR is trending. Prys leads with those instead of downloads and installs, which look good and pay nothing. For reference, the average app converts 2.12% of app store visitors into paying customers and the top quartile converts 3.41%, so a single point of conversion is often the difference between stalling and scaling.
Your own number tells you where you are, not whether it is good. A 9% monthly churn can feel normal until you see the top quartile under 5%, and a healthy-looking ARPU can hide a conversion problem upstream. The benchmark turns each metric into a decision: keep it, or fix it.
Your revenue, MRR, ARPU, LTV, churn, and conversion rates, each with your number beside the average and top-quartile benchmark.
Aggregated, anonymized data across 500+ apps connected to Prys, split into the average app and the top quartile.
Yes. A free version of the Revenues and KPIs page lets you see where you stand before upgrading.
Monthly, on a trailing basis: revenue and paying customers within the month, averaged across the period, so the numbers stay comparable over time.
Put your revenue and every growth KPI beside the benchmark, and know which numbers to keep and which to fix.